A Web Based Learning
Experience http://www.pmel.noaa.gov/tao/index.shtml http://www.pmel.noaa.gov/tao/proj_over/flash/mainDOC.html Have you ever watched the evening news with your folks and
wondered how the weather person could have been so wrong? You wore shorts
to school that day only to find yourself freezing during lunch. Predicting
the weather is a very difficult task. The many factors which impact your
daily local weather can be thousands of miles away, so Meteorologists use a
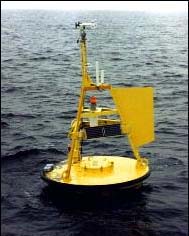
variety of different remote tools including satellites and buoys to help them
make predictions. The buoy to the right is an example of a tool used by
scientists. These experts make their predictions by building models using
historical and current data. El Niño and La Niña cycles are
examples of these complex patterns. In this investigation, you will learn
more about El Niño and La Niña
cycles, and how they impact the weather in your area. To accomplish this
task, you will be logging into one of same ocean buoys that scientists use to
develop their models. You will be
part of an expert team. Your team will consist of three or four students,
and be responsible for collecting data, organizing it in an appropriate graphic
form, and analyzing it for the purpose of making weather predictions in your
community. After making your prediction, you will write a speculation
paper that details how you reached your conclusion. Your last task will
be to share your findings with the scientific community. As winter
approaches, you will be on the hot seat, and youll get a taste of what it's
like to be a weather person. To be successful, you need to ask great
questions, seek out the answers, develop new relationships, and take a stand. THE PROCESS Step 1: In the news El Niño and La Niña cycles have a
tremendous impact on the world's weather. It is hard to believe that
ocean water temperatures in the Step 2: Background
information Split up and
assign each member of your group one of the Web pages listed below. After
exploring the Web pages individually, get back together in your group and
answer the following questions.
Resources : · About La Niña and El Niño - · Global La Niña Impacts
- · Global El Niño Impacts
- · El Niño Basics - Step
3: Review the (TAO) story ( http://www.pmel.noaa.gov/tao/proj_over/flash/mainDOC.html The TAO story is an animated PowerPoint-like presentation on what
the Tropical Atmospheric Ocean Project is all about. Each group member is
required to write 250 words on what TAO is and how and why they do what they
do. Explain who benefits from TAO. Step4:
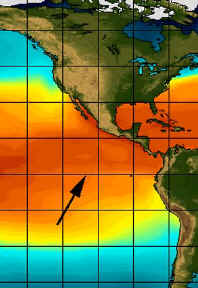
Real-time data It's time to
start gathering sea surface temperatures
(SST), so your team can begin to build a useful model. You will be
using a buoy located at 110 degrees West and 0 degrees
North. You will begin by gathering today's real-time data, and
then adding that value to the temperatures for the last 14-days. First you
will want to make a data table, and later you will convert this to graphs.
Step 4: Historical model Scientists
have been tracking SST for many years, and it has allowed them to create a
historical model that helps them predict El Niño and
La Niña cycles. Use the link below to answer
the following questions: · Which two years show
the greatest "positive" anomalies? · Which two years show
the greatest "negative" anomalies? · Compare the anomaly
graph you created in step 5 with the historical anomaly graph. Does it
look like the current year is either an El Niño or La
Niña cycle? ·
How could you make your model a better predictor of the cycle? Historical Anomaly Graph- TOA/TRITON Step 5: Temperatures and
participation The buoy we
have been tracking is several thousand miles away, so it is hard to believe
that sea surface temperatures can have an impact on your local weather.
Use the links below to investigate how the El Niño
and La Niña cycles impact your local weather.
You may want to split up the links between each of your team members, and allow
each individual to become a site expert. Be prepared to use this
information when you write your final speculation paper. · La Niña Seasonal U.S. Temperature
& Precipitation - · Seasonal Mean Temperatures and Precipitation for the · Words of CAUTION - by William S. Kessler NOAA /
Pacific Marine Environmental Laboratory ·
Cold and Warm Episodes by Season - Step
6: Speculation It's time for
you to take a stand. The model you developed in step 5 was only for a
15-day period, so you may also want to extend your graph to include a longer
period of time. You can access additional SST by visiting the TOA /
TRITON Data Delivery System. Is the world currently in an El Niño or La Niña cycle? Is the world having normal weather now, not influenced by any El Nino? What are your predictions for temperature and precipitation in your local area? You will be required to provide solid support when making your case. Your group needs to work together to reach consensus. After your group has reached consensus, your task is to construct a solid speculation essay, so you may want to read a few Tips on Writing Speculation Papers . You may also want to view a possible grading rubric before beginning .What You Are Required to Turn In 1. Step #1 Summary
(individual work 5 points) 2. Step #2 Background
questions (group 5 points) 3. Step #3 TAO Story
Summary (individual 5 points) 4. Step #4 Data
Collection and Analysis (group) c. SST comparison graph (5 points)
|
|||||||||||||||||||||||||